Plots
On this page we present the plots of our data.
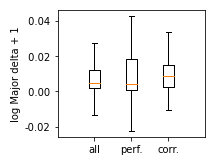
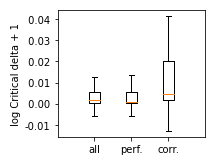
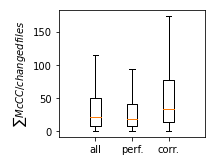
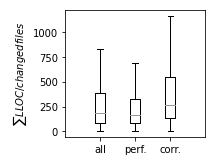
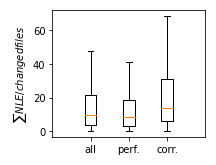
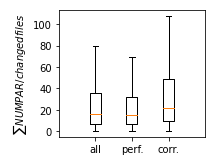
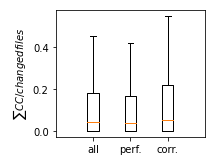
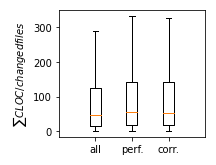
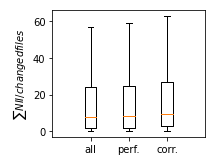
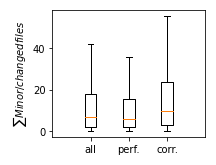
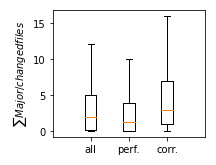
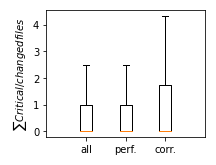
The plots on this page contain only our manually labeled data
for all changes including additions and deletions. As the types of changes are different in size we
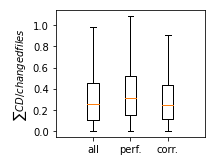
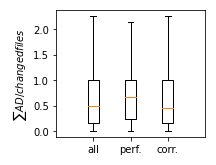
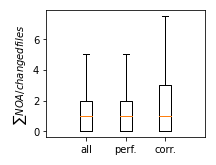
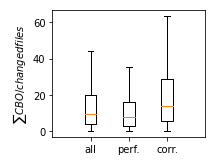
divide by the number of changed lines for each datapoint.
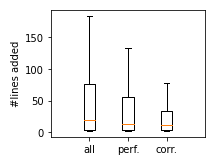
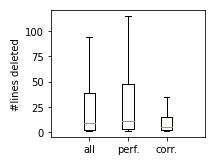
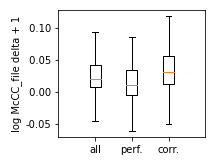
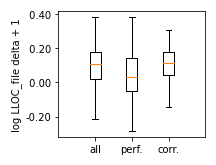
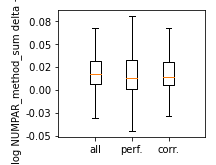
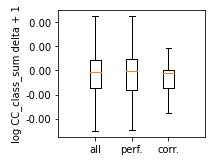
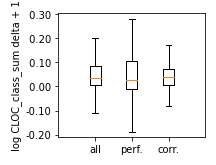
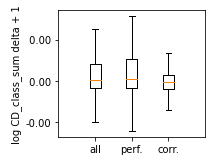
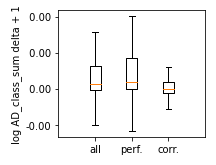
We can see, that perfective changes are usually deleting more than other changes and are smaller.
Corrective changes are even more smaller but tend to add more lines.
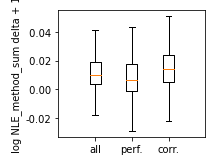
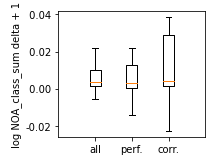
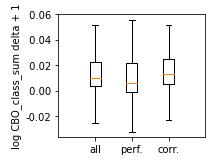
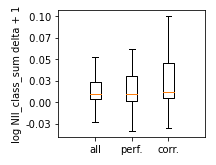
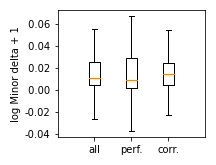
Some plots stand out directly. We can see that perfective changes reduce coupling and complexity as can be seen in the plots for NLE and McCC.
Corrective changes on the other hand are adding complexity in the form of McCC and NLE.
Statistically significant differences between perfective and all as well as corrective and all changes are denoted bold.
Size
| Perfective | Corrective | |||
|---|---|---|---|---|
| Metric | p-value | effect size | p-value | effect size |
| #lines added | <0.0001 | 0.20 (s) | <0.0001 | 0.21 (s) |
| #lines deleted | <0.0001 | 0.15 (s) | <0.0001 | 0.16 (s) |
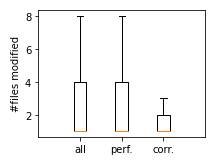
| #files modified | 0.2081 | - | <0.0001 | 0.22 (s) |
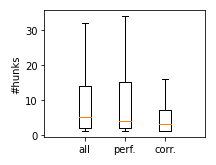
| #hunks | <0.0001 | 0.01 (n) | <0.0001 | 0.22 (s) |
ColumbusQM Metrics
| Perfective | Corrective | |||
|---|---|---|---|---|
| Metric | p-value | effect size | p-value | effect size |
| McC | <0.0001 | 0.39 (m) | 1.0000 | - |
| LLOC | <0.0001 | 0.45 (m) | 1.0000 | - |
| NLE | <0.0001 | 0.27 (s) | 1.0000 | - |
| NUMPAR | <0.0001 | 0.27 (s) | <0.0001 | 0.09 (n) |
| CC | 1.0000 | - | <0.0001 | 0.12 (s) |
| CLOC | <0.0001 | 0.16 (s) | <0.0001 | 0.05 (n) |
| CD | 1.0000 | - | <0.0001 | 0.16 (s) |
| AD | <0.0001 | 0.02 (n) | <0.0001 | 0.08 (s) |
| NOA | <0.0001 | 0.08 (n) | <0.0001 | 0.07 (n) |
| CBO | <0.0001 | 0.19 (s) | <0.0001 | 0.06 (n) |
| NII | <0.0001 | 0.19 (s) | <0.0001 | 0.02 (n) |
| Minor | <0.0001 | 0.19 (s) | <0.0001 | 0.05 (n) |
| Major | <0.0001 | 0.12 (s) | <0.0001 | 0.05 (n) |
| Critical | <0.0001 | 0.05 (n) | <0.0001 | 0.03 (n) |
Metric values prior to change (mean per file)
| Metric | Median all | Median perfective | Median corrective |
|---|---|---|---|
| McCC | 21.78 | 18.78 | 33.23 |
| LOC | 186.98 | 163.75 | 264.18 |
| NLE | 9.60 | 8.33 | 14.00 |
| NUMPAR | 16.06 | 15.00 | 22.00 |
| CC | 0.04 | 0.04 | 0.05 |
| CLOC | 46.25 | 55.00 | 54.00 |
| CD | 0.25 | 0.32 | 0.25 |
| AD | 0.50 | 0.67 | 0.46 |
| NOA | 1.00 | 1.00 | 1.00 |
| CBO | 9.67 | 8.00 | 14.00 |
| NII | 8.00 | 8.50 | 9.50 |
| Minor | 7.00 | 6.00 | 9.67 |
| Major | 2.00 | 1.25 | 3.00 |
| Critical | 0.00 | 0.00 | 0.00 |
| Perfective | Corrective | |||
|---|---|---|---|---|
| Metric | p-value | effect size | p-value | effect size |
| McC | <0.0001 | 0.05 (n) | <0.0001 | 0.08 (n) |
| LLOC | <0.0001 | 0.05 (n) | <0.0001 | 0.05 (n) |
| NLE | <0.0001 | 0.04 (n) | <0.0001 | 0.07 (n) |
| NUMPAR | 0.6367 | - | 0.0218 | - |
| CC | <0.0001 | 0.01 (n) | 0.0011 | - |
| CLOC | <0.0001 | 0.12 (s) | <0.0001 | 0.06 (n) |
| CD | <0.0001 | 0.15 (s) | <0.0001 | 0.15 (s) |
| AD | <0.0001 | 0.17 (n) | <0.0001 | 0.15 (s) |
| NOA | 0.5109 | - | <0.0001 | 0.02 (n) |
| CBO | <0.0001 | 0.09 (n) | <0.0001 | 0.07 (n) |
| NII | <0.0001 | 0.05 (s) | <0.0001 | 0.04 (n) |
| Minor | <0.0001 | 0.04 (s) | <0.0001 | 0.02 (n) |
| Major | <0.0001 | 0.09 (s) | <0.0001 | 0.04 (n) |
| Critical | <0.0001 | 0.05 (n) | <0.0001 | 0.03 (n) |